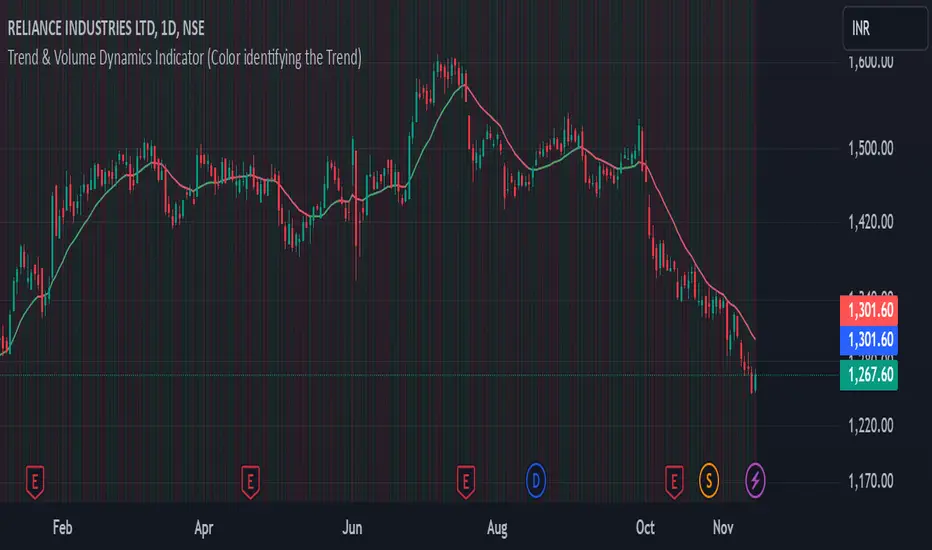
Trend & Volume Dynamics Indicator (Color identifying the Trend)Benefits
1. Trend Identification:
o The script calculates a 20-period Weighted Moving Average (WMA) of the closing prices. This helps in smoothing out price data to identify the underlying trend.
o The color of the WMA line changes based on the price position relative to the WMA:
Green: When the current price is above the WMA, indicating a potential uptrend.
Red: When the current price is below the WMA, indicating a potential downtrend.
Blue: When the price is exactly at the WMA, indicating no clear trend.
2. Volume Dynamics:
o The script also plots the volume with a color-coding mechanism:
Green: When the current volume is higher than the previous period's volume, indicating increasing trading activity.
Red: When the current volume is lower than the previous period's volume, indicating decreasing trading activity.
o The volume bars are plotted with 90% transparency, making them less visually dominant but still informative.
Usage
• Overlay: The indicator is set to overlay=true, meaning it will be plotted directly on the price chart, allowing users to see the WMA and volume dynamics in the context of the price movements.
• WMA Length: The length of the WMA is set to 20 periods, which is a common setting for short to medium-term trend analysis.
• Visual Cues: The color changes in both the WMA and volume bars provide immediate visual cues about the trend and volume dynamics, helping traders make quicker decisions.
Detailed Explanation of the Script
1. Indicator Declaration:
o Declares the indicator with a descriptive name and specifies that it should be overlaid on the price chart.
2. WMA Calculation:
o Defines the length of the WMA and calculates it using the closing prices.
3. Plotting the WMA:
o Plots the WMA with full brightness (0 transparency).
4. Color-Coding the WMA:
o Changes the color of the WMA line based on the price's position relative to the WMA.
5. Volume Indicator:
o Plots the volume bars with color-coding based on the volume change from the previous period and with 90% transparency.
Conclusion
One of the most best combinations of Volume and Moving average and works on any given timeframe and charts
스크립트에서 "VOLUME BAR"에 대해 찾기
Volume Bull/Bear Activity [ZC]Volume Bull/Bear Activity Summary
This indicator generates a summary of bull/bear activity for 20 symbols.
For each symbol, two bars are displayed, colored green and red.
The green bar indicates bull volume, reflecting activity within the last candle of the symbol.
The red bar signifies bear volume within the real-time bar, continuously updated.
You can seamlessly adjust the timeframe for this indicator.
Features :
Bear/Bull Volume bars ( Realtime )
ability to add 20 symbols
price is colored in Green or red to determine if its Green/Red candle .
More into its data

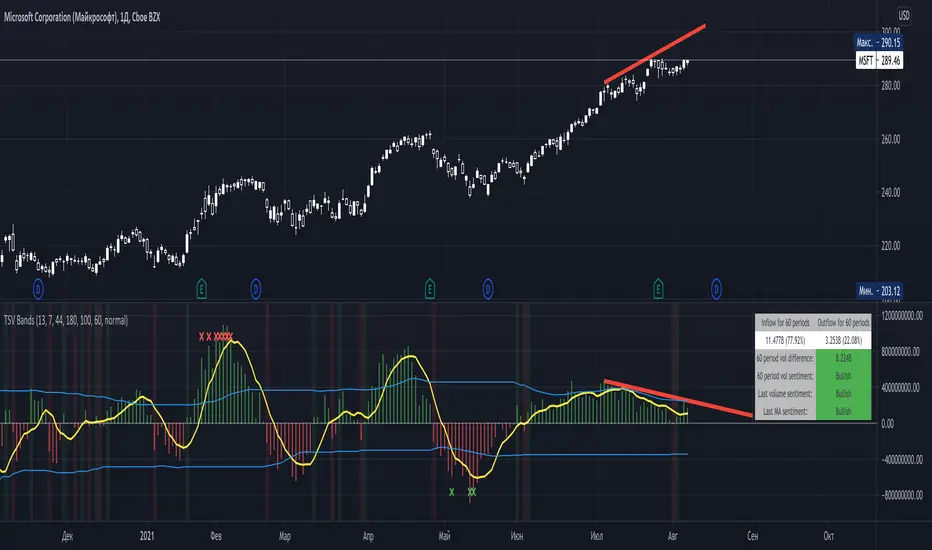
Time Segmented Volume BandsTime Segmented Volume Bands
This time I took as a basis TSV - Time Segmented Volume, a rather rare one, almost never mentioned on TradingView.
TSV is a leading indicator because its movement is based on both the movement of the stock price and its volume. Ideal entry and exit points are usually found when a stock moves through a baseline. This indicator is similar to the more well-known balance volume (OBV) because it measures the amount of money flowing in or out of a particular stock.
What is their main difference between TSV and OBV?
Time Segmented Volume is used to eliminate distortions of the standard volume graph. OBV is based on cumulative total volume, while TSV compares the current time period with the previous one, without a subtotal.
What I added on my own script
Bands, similar to Bollinger. The main idea is to have an idea of the average inflow and outflow of volumes from / to shares for a particular period. We have an opportunity to estimate how much the current volumes differ from the average for 60 days (all values can be flexibly adjusted).
Excess markers by the current average volume (sensitivity can be adjusted separately).
A table that calculates the total sentiment (force) of volume on average for N periods in comparison with the current one.
Sell/buy markers
How to read a TSV graph
The main graph is a histogram. Green bars mean an inflow of volume, red bars mean an outflow. When the red volume crosses the baseline zero, it is considered a buy signal (in the classic TSV version). A similar sell signal - just the opposite. I highlight them with a colored background fill.
It is especially important to find divergences on the chart. For example, when the volume peaks getting lower but the price rises (short).
The yellow line is the average TSV for 7 periods. Just a smoother lagging line.
Blue stripes. Above - the average inflow of volumes over N periods (44 days). Below - the average outflow.
Markers are additional buy / sell signals generated when the current TSV value exceeds the average for N periods. In the script settings, you can choose how many percent deviations from the average should occur in order to count it as a strong signal (by default, an excess of 180% for selling, 100% for buying). The main idea of the marker is to catch a better price than with the standard TSV logic (take at the intersection of the zero line). The marker can serve as both an assistant and drive into a trap. If you are not very confident, then it is better to adhere to standard practice, and set the excess of markers to completely abnormal situations, so that it triggers less often.
Colored background - a classic buy or sell zone (when crossing the TSV baseline).
Table - you can configure its presence and size in the settings. On it you can estimate the sentiment of the movement of money for the last N periods. Pay particular attention to the % value in parentheses. It shows the strength of the trend in volumes over N periods.
The basic rule, as with any trend indicator: do not trade against the trend. A sell signal in a constantly rising channel is not a short signal. This is a signal for a possible fixation of a part of the position. No more.
How do I use this indicator?
For starters, I never make decisions purely based on an indicator. TSV plays the role of a clearer visualization of volumes for me. If I see that the volumes are fading away (thin market), then I try not to enter the trade. For the last two weeks, while picking charts, I completely abandoned standard volume bars in favor of TSV due to it's greater informative.
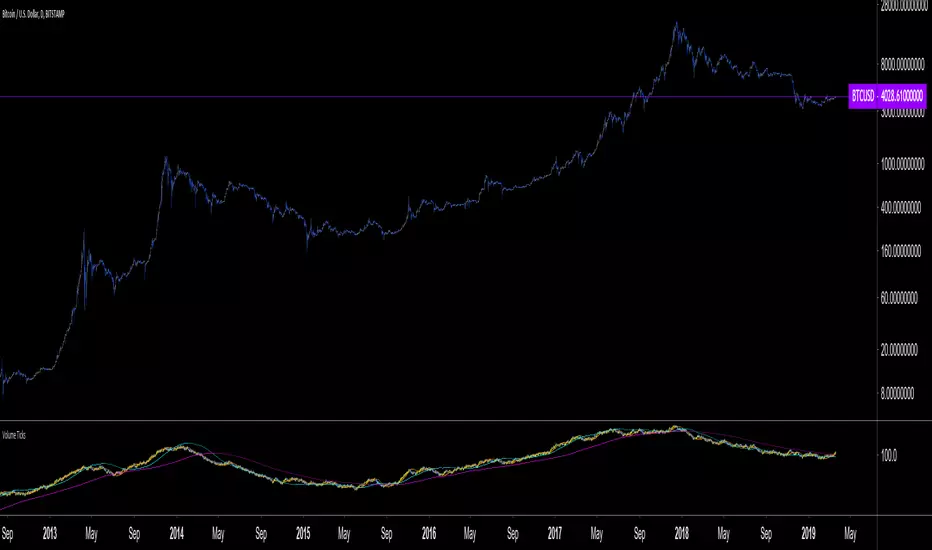
Accumulation/Distribution Volume (ADV) [cI8DH]This is the simplified and optimized version of my original ADV indicator. It shows both regular volume bars and the accumulated/distributed (A/D) portion of them. The equation is elegant and intuitive. It calculates candle body to candle height ratio and multiplies it by volume: volume*(close-open)/(high-low). This is the building block of my three other indicators, ADL, ADP and ADMF.
- The volume bars has two shades of green and red. The dark shade shows amount of A/D and the light shade shows total volume (what you see on a regular volume indicator).
When money volume is enabled, volume is multiplied by price. As you can see in the chart below, trade volume in terms of USD was growing over the past years.
- Blue line is the moving average of A/D and the orange line is for total volume. When "Baseline Chart" option is enabled, this moving average is identical to ADMF indicator which can be a powerful indicator for assessing buy/sell pressure as well as money flow and volume divergences. You can turn off volume bars (from style menu) for better visibility or you can use the below indicators.
Please note that ADMF is now available as a part of ADP indicator as well and I recommend using the latter since ADP can also replace CMF and MFI indicators.
- If you change the aggregation to cumulative (while having money volume disabled), the gray line becomes identical to On Balance Volume (OBV) and the blue line identical to my ADL indicator. The latter I would argue is more accurate than Chaikin's ADL, William's A/D and OBV.

Volume VisualizerVolume by Hannsome
The Volume Visualizer is a simple yet effective tool designed to display trading volume in a dedicated panel below the main price chart. Its primary goal is to help you easily identify when trading activity is significantly higher than usual.
The indicator plots two key elements:
Volume Bars: These are standard volume bars showing the amount of trading activity for each period. To draw your attention to important moments, bars with unusually high volume are highlighted in a distinct color (yellow by default).
Average Volume Line: A moving average line (orange by default) is plotted over the volume bars. This line represents the recent average trading volume, giving you a clear baseline to compare the current volume against.
A "significant" volume spike is defined as any period where the volume exceeds the moving average by a certain multiplier. You can adjust both the moving average length and this multiplier in the indicator's settings to fine-tune its sensitivity to what you consider a significant spike in activity.

SMA Custom Volume BandsThe "SMA Custom Volume Bands" indicator is a custom technical analysis tool designed for use on the TradingView platform. This indicator allows users to analyze and visualize key aspects of a stock's volume within the context of its 200-period Simple Moving Average (SMA). It features the following components:
Volume Bars: The indicator displays the volume of a selected financial instrument using colored bars. Green bars represent days when the trading volume is higher than the previous day, while red bars represent days when the trading volume is lower.
200 SMA of Volume: A blue line on the chart represents the 200-period Simple Moving Average of the trading volume, providing insight into the longer-term volume trend.
Customizable Percentage Line: Users have the flexibility to set a custom percentage value above or below the 200 SMA of trading volume. This line is plotted as a blue line on the chart, allowing traders to identify when volume meets their preferred percentage threshold.
The "SMA Custom Volume Bands" indicator is a simple tool for traders, aiding in the assessment of volume trends and potential price reversals in the context of moving averages. It offers customization options, enhancing its adaptability to individual trading strategies and preferences.

Multiple Percentile Ranks (up to 5 sources at a time)This indicator is a visual percentile rank indicator that can display 1 to 5 sources at one time.
The options:
“Sources”
Choose the number of sources you would like to display. The minimum is 1, the maximum is 5.
“Label percent position”
The label for the current percentage of where the source candle ranks.
“Label position”
This displays the source/s you’ve selected, and the chosen bottom rank % and top rank %.
“Label text size”
Displays the text size of all labels.
“Display current % labels”
Switches the labels on/off only for the current percentage rank of each source.
Source options:
ATR: Average True Range
CCI: Commodity Channel Index
COG: Centre of Gravity
Close: closing price
Close Percent: close percentage from previous close
Dollar Value: volume * (high * low * close / 3)
EOM: Ease of Movement: how much volume it takes to move the price in a certain direction
OBV: On-Balance Volume
RANGE: percentage range of the close price
RSI: Relative Strength Index
RVI: Relative Vigor Index
Time Close: if you select the 1 second timeframe it will provide the gap of time between each 1 second close
Volume: each bar’s volume
Volume (MA): volume moving average
Source # where # is the number of the source. Selects the source you’d like.
Ma Length is the number of previous candles to consider when calculating the moving average of the source. Note, the “MA Length” only applies to sources that have the “(MA)” at the end of their name.
Bottom % is the bottom percentage rank of the source you’ve selected. This is a filter to display the candle line graph in red once the percentage rank is equal to the percentage you’ve chosen or below.
Top % is the top percentage rank of the source you’ve selected. This is a filter to display the candle line graph in green once the percentage rank is equal to the percentage you’ve chosen or higher.
A simple example of how to use the indicator:
Select the dropdown menu for source 1 and select volume.
As the candles populate, it will look at previous candles and assign a percentage rank of where the candles are in relation to previous candles.
*Note, the way Tradingview works is it will populate the first candle the chart was active, and continue on. So, let’s say the 3rd candle was the highest volume day. This candle will show up as 100%. If the next day, the 4th candle has an even higher volume, it will show up as 100% also, the previous candles won’t “repaint” to other values and are instead set based on when they were confirmed. So, this indicator works best when there are a lot of previous candles to compare itself to.
To use the bottom % rank filter enter a percentage such as 5%. As it comes across a candle that is 5% or less compared to previous volume candles, then the line graph will shade in red.
The same can be said for the top % rank. So, if you want to see the line graph change to green when it comes across the top 99th percentile rank of volume bars, then set the top % rank to 1% and it will give you extremely high-volume bars in green instead of blue.

VXD SupercycleVXD is a brand new indicator and still developing. to minimize stop losses and overcome sideways market conditions, Higher Timeframe are recommended
Trend lines
-using Rolling VWAP as trend line to determined if Volume related to a certain price.
-you can switch RVWAP to EMA in the setting
ATR
-trailing 12*ATR and 2.4 Mutiplier
Pivot point and Rejected Block
Pivot show last High and low of a price in past bars
Rejected Block show when that High or Low price are important level to determined if it's Hidden Divergence or Divergence
Symbols on chart show Premium and Discount Prices
X-Cross - show potential reversal trend with weak volume .
O-circle - show potential reversal trend with strong volume .
Setting
Momentum: RSI = 25 , RSI MA = 14
Trend: Rolling VWAP and ATR and Subhag
Trailing STOP: ATR 12 x 2.4
Highlight Bars color when volume is above SMA 6
SMA200 act as TP Line
Risk:Reward Calculation
if Buy your Stoploss will be previous Pivot low
if Sell your Stoploss will be previous Pivot high and will be calculated form there, then show TP in Orange color line
VXD เป็นระบบเทรดที่ผมทดลองเอาหลาย ๆ ไอเดีย ทั้งจาก Youtube facebook และกลุ่มคนต่าง ๆ มารวบรวมไว้ แล้วตกผลึกขึ้นมาเป็นระบบนี้ ใน Timeframe ใหญ่ ๆ สามารถลากได้ทั้ง Cycle กันเลย
Trend lines
-ใช้ Rolling VWAP ของแอพ Tradingview (สามารถตั้งแค่าเป็น EMA ได้)
ATR
-ใช้ค่า ATR 12 Mutiplier 2.4
Pivot point and Rejected Block
Pivot โชว์เส้น High low และมีผลกับออเดอร์ หากแท่งเทียนปิดทะลุเส้นนี้
Rejected Block วาดแนวรับ-ต้าน อัตโนมัติ ใช้ประกอบ RSI ว่ามี Divergence หรือไม่
สัญลักษณ์ต่าง ๆ
X-Cross - แท่งกลืนกิน วอลุ่มน้อย
O-circle - แท่งกลืนกิน มีวอลุ่ม
Setting
Momentum: RSI = 25 , RSI MA = 14
Trend: Rolling VWAP and ATR and Subhag
Trailing STOP: ATR 12 x 2.4
Highlight Bars color when volume is above SMA 6
SMA200 act as TP Line
Risk:Reward Calculation
หาก Buy จุด SL จะอยู่ที่ Pivot low
หาก Sell จุด SL จะอยู่ที่ Pivot high และระบบจะคำนวณจากตรงนั้น จากนั้นแสดงเป็นเส้น TP สีส้ม
This Strategy Combined the following indicators and conditioning by me
ATR , RSI , EMA , SMA
Rolling VWAP - /script/ZU2UUu9T-Rolling-VWAP/
Regression Lines - Subhag form Subhag Ghosh /script/LHHBVpQu-Subhag-Ghosh-Algo-Version-for-banknifty/
Rejection Block , Pivots , High Volume Bars and PPDD form Super OrderBlock / FVG / BoS Tools by makuchaku & eFe /script/aZACDmTC-Super-OrderBlock-FVG-BoS-Tools-by-makuchaku-eFe/
ขอให้รวยครับ.

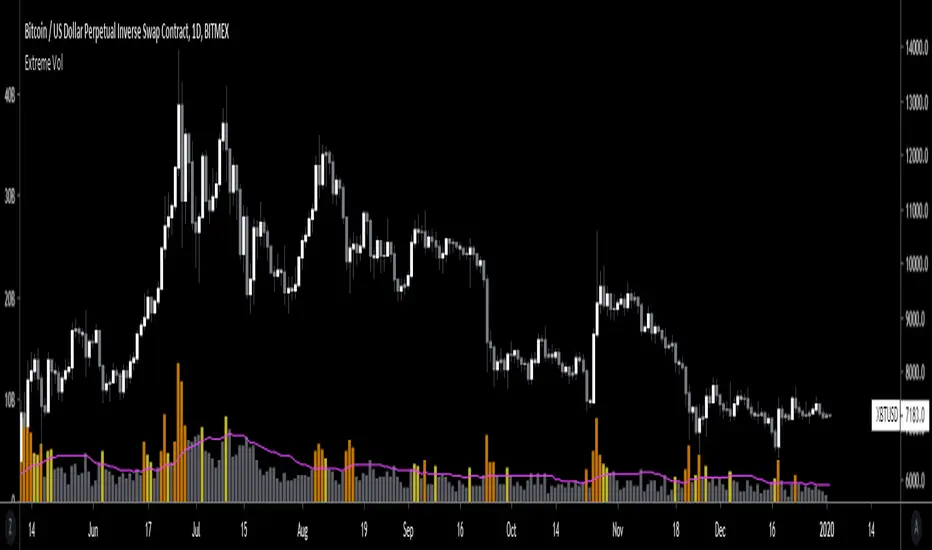
Extreme VolumeThis indicator colors volume bars that are significantly higher volume than the vol moving average ( SMA ). Utilizes two multiplier that can be adjusted by user. Defaults are that the indicator colors volume bars yellow if 20% higher than average, and orange if over 50% higher than average.
Reason why i created this indicator is i typically don't care about volume unless it is significantly higher than average. I find extreme volume useful for confirmation of a breakout, etc. This is why the rest of the volume bars are gray, they are still available for reference, but I dont pay much attention until volume is higher than average.
Also, when you load this indicator it will be in its own pane below the chart. To try and figure out how to add it to same pane as the chart was a huge pain in the ass. Once you figure it out it is pretty easy. I'll try to explain below...
Next to the indicator name you have the following options ... Hide, Settings, Show Source Code{}, Delete(X), and More (3 dots)
1) Click on "More" (3 dots)
2) Click on "Move To" then chose "Existing Pane Above"
3) Volume will likely be too large. Volume scale should be on left side, use your mouse to adjust volume smaller
4) Volume will likely be in the middle of your chart, click on it and drag it down.
Volume Ticks - Increasing Volume Bar Count [LucF]Volume Ticks is a zero-lag market sentiment indicator. It works by providing a cumulative count of increasing volume columns.
A one count is added for each increasing volume column where close>open, and one is subtracted on an increasing volume column if close
Argentum Flag [AGP] Ver.2.5Central Purpose and Concept
The Argentum Flag script is a multifunctional tool that integrates and visualizes multiple key indicators to provide a detailed and unified perspective of the market. The core concept is to analyze price from different angles—volatility, volume, and momentum—to identify confluences and patterns that may be difficult to see with separate indicators. This "mashup" is not a simple fusion of indicators, but a strategic combination of tools that complement each other to offer a comprehensive view of asset behavior.
Components and Their Functionality
This script combines and visualizes the following elements:
EMA Percentage Bands (EMA Bands):
Uses an Exponential Moving Average (EMA) as a baseline.
Calculates and draws several volatility bands that deviate from the central EMA by fixed percentages (0.47%, 0.94%, 2.36%). These bands are inspired by Fibonacci ratios and the cyclical nature of the market.
The bands are colored with a dynamic gradient that reflects the current state of volatility.
Utility: These bands act as dynamic support and resistance areas. The price entering or exiting these zones can indicate a change in volatility or a possible exhaustion of the movement.
Volatility Signals (Vortex & Prime Signals):
The script generates visual signals when the price stays outside the volatility bands for a specific number of bars.
Vortex Signals (diamond ⍲): Appear when the price crosses and stays outside the Prime bands, suggesting a high volatility or a possible continuation of the trend.
Exit/Entry Signals (circle ⌾): Are activated when the price stays outside the Vortex bands, indicating an extreme extension of volatility. These can be interpreted as potential reversal or profit-taking zones.
Utility: They help traders quickly identify moments of high and low volatility and potential turning points in price action.
Volume Analysis (Volume Bar Colors):
The script changes the color of the bars based on the relationship between the current volume and the average volume over a 50-bar period.
Utility: This feature allows the trader to immediately visualize the strength behind a price movement. For example, a bullish candle with "extreme" volume suggests strong buying interest, while a bearish candle with "low" volume could indicate a weak correction.
Summary Tables (Dashboard):
EMA-Fibo Table: Displays the values of 12 EMAs based on the Fibonacci sequence (5, 8, 13, 21...) in an easy-to-access table. The background color of each value indicates if the current price is above (bullish) or below (bearish) that EMA.
Multi-Timeframe RSI Table: Displays the Relative Strength Index (RSI) values across multiple timeframes (from 1 minute to monthly). The text color changes to highlight if the RSI is in overbought (orange) or oversold (white) areas, according to the established levels.
Utility: These tables condense a large amount of data into a simple format, allowing traders to perform a quick, multi-timeframe market analysis without constantly switching charts.
How to Use the Script
This script is a contextual analysis tool that works best when its different components are combined. It is not a "buy and sell signal" system on its own, but a tool for informed decision-making.
Trend Identification: Use the EMA table to see the general trend direction across different timeframes. A price above most of the EMAs in the table suggests a bullish bias.
Volatility Reading: Observe the EMA bands. If the price stays within the bands, volatility is low. A strong move that breaks out of the bands, accompanied by an "extreme" volume color (blue), suggests strong momentum that could continue.
Momentum Analysis: Use the RSI table to confirm movements. An overbought 15m RSI could support a reversal signal from the Vortex bands, while a 1D RSI in a neutral zone may indicate that the main trend has not changed.
Signal Confirmation: Visual signals (diamond and circle) should not be used in isolation. They must be confirmed by volume analysis and dashboard readings. For example, an "Exit Signal" (circle) with low volume may be less reliable than one with high volume and a clear reversal candle.
Disclaimer
This script is for informational and educational purposes only. It is not financial advice, nor is it a recommendation to buy or sell any financial instrument. All trading involves risk, and past performance is not indicative of future results. The user is solely responsible for their own trading decisions.

Pivot Matrix & Multi-Timeframe Support-Resistance Analytics________________________________________
📘 Study Material for Pivot Matrix & Multi Timeframe Support-Resistance Analytics
(By aiTrendview — Educational Use Only)
________________________________________
🎯 Introduction
The Pivot Matrix & Multi Timeframe Support-Resistance Analytics indicator is designed to help traders visualize pivot points, support/resistance levels, VWAP, and volume flow analytics all in one place. Rather than giving explicit buy/sell calls, the dashboard provides reference insights so a learner may understand how different technical levels interact in real time.
This document explains its functionality step by step with formulas and usage guides.
________________________________________
1️⃣ Pivot System Logic
Pivot points are classic tools for mapping market support and resistance levels.
✦ How Calculated?
Using the Traditional Method:
• Pivot Point (PP):
PP=Highprev+Lowprev+Closeprev3PP = \frac{High_{prev} + Low_{prev} + Close_{prev}}{3}PP=3Highprev+Lowprev+Closeprev
• First Support/Resistance:
R1=2×PP−Lowprev,S1=2×PP−HighprevR1 = 2 \times PP - Low_{prev}, \quad S1 = 2 \times PP - High_{prev}R1=2×PP−Lowprev,S1=2×PP−Highprev
• Second Support/Resistance:
R2=PP+(Highprev−Lowprev),S2=PP−(Highprev−Lowprev)R2 = PP + (High_{prev} - Low_{prev}), \quad S2 = PP - (High_{prev} - Low_{prev})R2=PP+(Highprev−Lowprev),S2=PP−(Highprev−Lowprev)
• Third Levels:
R3=Highprev+2×(PP−Lowprev),S3=Lowprev−2×(Highprev−PP)R3 = High_{prev} + 2 \times (PP - Low_{prev}), \quad S3 = Low_{prev} - 2 \times (High_{prev} - PP)R3=Highprev+2×(PP−Lowprev),S3=Lowprev−2×(Highprev−PP)
• Similarly, R4/R5 and S4/S5 are extrapolated from extended range multipliers.
✦ How Used?
• Price above PP → bullish control bias.
• Price below PP → bearish control bias.
• R1–R5 levels act as resistances; S1–S5 act as supports.
Learners should watch how candles behave when approaching R/S zones to spot breakout vs. rejection conditions.
________________________________________
2️⃣ Multi Timeframe Logic
The indicator allows using daily-based pivot values (via request.security). This ensures alignment with institutional daily levels, not just intraday recalculations.
✦ Teaching Value
Understanding MTF pivots shows how markets respect higher timeframe levels (daily > intraday, weekly > daily). This helps learners grasp nested support-resistance structures.
________________________________________
3️⃣ VWAP (Volume Weighted Average Price)
Formula:
VWAPt=∑(Pricei×Volumei)∑(Volumei),Pricei=High+Low+Close3VWAP_t = \frac{\sum (Price_i \times Volume_i)}{\sum (Volume_i)}, \quad Price_i = \frac{High + Low + Close}{3}VWAPt=∑(Volumei)∑(Pricei×Volumei),Pricei=3High+Low+Close
Usage:
• VWAP is used as an institutional benchmark of fair value.
• Above VWAP = bullish flow.
• Below VWAP = bearish flow.
Learners should check whether price respects VWAP as a magnet or uses it as support/resistance.
________________________________________
4️⃣ Volume Flow Analysis
The script classifies buy volume, sell volume, and neutral volume.
• Buy Volume = if close > open.
• Sell Volume = if close < open.
• Neutral Volume = if close = open.
For daily tracking:
Buy%=DayBuyVolDayTotalVol×100,Sell%=DaySellVolDayTotalVol×100Buy\% = \frac{DayBuyVol}{DayTotalVol} \times 100, \quad Sell\% = \frac{DaySellVol}{DayTotalVol} \times 100Buy%=DayTotalVolDayBuyVol×100,Sell%=DayTotalVolDaySellVol×100
Usage for Learners:
• Dominant Buy% → accumulation/ bullish pressure.
• Dominant Sell% → distribution/ bearish pressure.
• Balanced → sideways liquidity building.
This teaches observation of order flow bias rather than relying only on price.
________________________________________
5️⃣ Dashboard Progress Bars & Colors
The script uses visual progress bars and dynamic colors for clarity. For example:
• VWAP Backgrounds: Green shades when price strongly above VWAP, Red when below.
• Volume Bars: More green blocks mean buying dominance, red means selling pressure.
This visual design turns concepts into easy-to-digest cues, useful for training.
________________________________________
6️⃣ Market Status Summary
Finally, the dashboard synthesizes all data points:
• Price vs Pivot (above or below).
• Price vs VWAP (above or below).
• Volume Pressure (buy side vs sell side).
Status Rule:
• If all three align bullish → Status box turns green.
• If mixed → Neutral grey.
• If bearish dominance → weaker tone.
Why Important?
This teaches learners that market conditions should align in confluence across indicators before confidence arises.
________________________________________
⚠️ Strict Disclaimer (aiTrendview)
The Pivot Matrix & Multi Timeframe Support-Resistance Analytics tool is developed by aiTrendview for strictly educational and research purposes.
❌ It does NOT provide buy/sell recommendations.
❌ It does NOT guarantee profits.
❌ Unauthorized use, copying, or redistribution of this code is prohibited.
⚠️ Trading Risk Warning:
• Trading involves high risk of financial loss.
• You may lose more than your capital.
• Past levels and indicators do not predict future outcomes.
This tool must be viewed as a visual education aid to practice technical analysis skills, not as trading advice.
________________________________________
✅ Now you have a step by step study guide:
• Pivot calculations explained
• VWAP with logic
• Volume breakdown
• Visual analytics
• Status confluence logic
• Disclaimer for compliance
________________________________________
⚠️ Warning:
• Trading financial markets involves substantial risk.
• You can lose more money than you invest.
• Past performance of indicators does not guarantee future results.
• This script must not be copied, resold, or republished without authorization from aiTrendview.
By using this material or the code, you agree to take full responsibility for your trading decisions and acknowledge that this is not financial advice.
________________________________________
⚠️ Disclaimer and Warning (From aiTrendview)
This Dynamic Trading Dashboard is created strictly for educational and research purposes on the TradingView platform. It does not provide financial advice, buy/sell recommendations, or guaranteed returns. Any use of this tool in live trading is completely at the user’s own risk. Markets are inherently risky; losses can exceed initial investment.
The intellectual property of this script and its methodology belongs to aiTrendview. Unauthorized reproduction, modification, or redistribution of this code is strictly prohibited. By using this study material or the script, you acknowledge personal responsibility for any trading outcomes. Always consult professional financial advisors before making investment decisions.

BuySell Volume Bar Chart• Separates estimated Buy and Sell volume per bar using price action logic
• Plots them in a dual-axis format: buy volume goes up, sell volume goes down
• Colors are dynamic — whichever side dominates gets the stronger color, the weaker side is shaded
• Includes a live difference metric (Δ Volume) as a third value in the indicator title
• Automatically filters out flat/no-move bars to avoid misleading spikes
The live difference metric ("Δ Volume") can be controlled.
This metric calculates the difference between the buying and selling volume live, where it takes the Buy Volume - Sell Volume.
This difference is then displayed in either green (BV > SV) or red (SV > BV). You can toggle it on/off by entering the indicator's settings or double tapping the indicator name on the TV chart.
Another pretty cool thing is the modular colors - you can customize your candle colors and shades to your liking within the code!

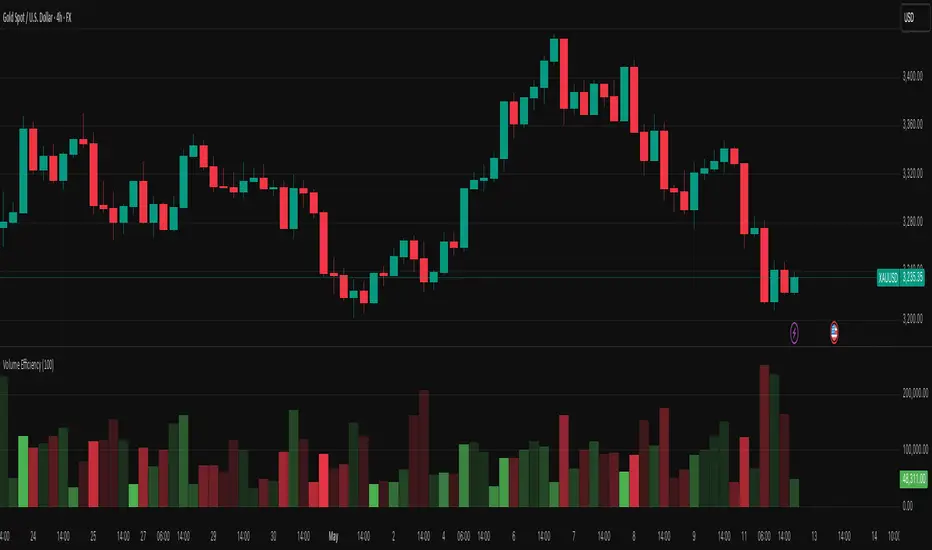
Volume EfficiencyThis indicator displays each candle's volume in an enhanced visual form, combining the amount of volume with the efficiency of the price movement.
Each volume bar changes its color intensity based on:
Higher efficiency (large price movement with low volume) → stronger color.
Lower efficiency (high volume with little price movement) → weaker color.
Additionally:
Green: Bullish candles (close > open).
Red: Bearish candles (close < open).
The color reflects not only the volume but also how "easily" the price moved.
The efficiency calculation is based on the actual body movement of the candle (abs(close - open)) divided by the total volume, dynamically adjusted to the maximum efficiency over the last N candles (configurable).
Interpretation:
Intensely green or red volume bars: clean and efficient movements (low resistance).
Pale bars: market absorption or indecision (high volume but little price movement).
Configurable parameter:
Efficiency period: number of candles used to normalise the maximum efficiency.
Multitimeframe Fair Value Gap – FVG (Zeiierman)█ Overview
The Multitimeframe Fair Value Gap – FVG (Zeiierman) indicator provides a dynamic and customizable visualization of institutional imbalances (Fair Value Gaps) across multiple timeframes. Built for traders who seek to analyze price inefficiencies, this tool helps highlight potential entry points, unmitigated gaps, and directional bias using smart volume logic and adaptive visual elements.
A Fair Value Gap (FVG) forms when there's a three-candle sequence in which a market imbalance leaves a "gap" between the wicks of candle 1 and candle 3. These areas are often considered footprints of institutional activity, and this indicator gives you the tools to track them with surgical precision across any timeframe you choose—regardless of the one you're viewing.
This indicator also includes a trend filter powered by a low-pass Butterworth filter, enabling traders to distinguish between countertrend vs. trend-aligned FVGs for more intelligent decision-making. On top of that, it features a dynamic FVG table for live tracking and bull/bear volume power visualization inside each gap, adding powerful clarity to market intent.
█ How It Works
The indicator analyzes the open, high, low, close, and volume of candles from a user-selected timeframe. It identifies Fair Value Gaps based on wick logic and only confirms those that meet customizable strength criteria. Once detected, the indicator visualizes each FVG with dynamically extending boxes, optional buy/sell volume bars, and a real-time mitigation check.
⚪ Multitimeframe Logic
Users can analyze FVGs from a higher or lower timeframe regardless of their current chart.
This is achieved using request.security() to fetch OHLCV data from the chosen timeframe.
⚪ Wick Sensitivity & Impulse Filter
The script measures the wick size of potential FVG candles and compares them to a running average. Only FVGs with wick sizes above a certain sensitivity threshold (user-controlled) are plotted. This ensures only meaningful price dislocations (e.g., strong impulsive moves) are shown, reducing noise.
⚪ Midpoint Mitigation Logic
FVGs are marked as "mitigated" when the price revisits the gap area. Traders can choose whether full gap closure or just a midpoint touch is required. This allows faster reactivity in real-time trading environments.
⚪ Bull & Bear Power – Volume-Weighted Visualization
Every Fair Value Gap box includes sub-bars representing the estimated buy and sell effort that created the gap. These are calculated using the candle's close in relation to its high/low range and volume:
Buy Volume % ≈ effort from low to close
Sell Volume % ≈ effort from high to close
Each sub-bar inside the FVG:
Is color-coded (UpCol for bullish, DnCol for bearish)
Is drawn proportionally to the strength of buyers or sellers
Visually displays who was in control during the imbalance
⚪ FVG Table – Dynamic On-Chart Overview
The indicator includes an optional on-chart table that displays all currently active (unmitigated) FVGs in a side panel format:
Automatic updates as gaps are formed and mitigated
Color-coded rows to show bullish vs. bearish FVGs
Timestamps to know precisely when the gap formed
User-controlled position via Table Left and Table Right
This is a gap watchlist overlay, giving traders a concise view of current inefficiencies without manually scanning the chart.
⚪ FVG Trend Filter (Butterworth Smoother)
Using a two-pole Butterworth low-pass filter, the indicator computes a trendline based on average FVG values, offering a smooth but responsive directional signal.
Passband Ripple (dB): Controls sensitivity and overshoot tolerance
Cutoff Frequency (0–0.5): Sets how quickly the trendline reacts
The trendline helps categorize each FVG:
Trend up → favor bullish FVGs
Trend down → favor bearish FVGs
It adds an extra dimension to FVG entries, helping distinguish between trend-aligned and countertrend signals.
█ How to Use
⚪ Identify Institutional Gaps
Use this tool to identify areas where institutions may have left imbalances behind quickly.
These areas often become:
Strong support/resistance zones
Areas where price might react sharply
Targets for liquidity sweeps or retracements
⚪ React to Trend or Countertrend
The built-in trendline helps categorize each FVG:
Trend up → Bullish FVGs have higher validity
Trend down → Bearish FVGs have higher validity
⚪ Volume Context via Bull/Bear Power
Each Fair Value Gap is more than just a price imbalance — it’s a story of effort and intent. The Bull/Bear Power feature visualizes the buy and sell pressure behind each FVG, helping you understand how the gap was formed and who was in control.
A bullish FVG with a strong buy effort suggests continuation potential — buyers dominated the move.
A bullish FVG with a dominant sell effort could signal a trap or reversal — sellers may have overwhelmed the breakout.
These insights allow you to confirm imbalance strength, spot traps early, and add confidence to entries based on dominant volume profiles.
Instead of viewing gaps as static zones, this feature turns each into a live volume map — a visual breakdown of who moved the market and whether that move had conviction.
⚪ Plan with the FVG Table
The FVG Table acts as your on-chart control center for tracking active imbalances. When enabled, it provides a clear summary of all unmitigated Fair Value Gaps, helping you stay organized and focused during fast-moving sessions.
Track live and historical gaps: See exactly when and where each FVG formed.
Monitor older, still-valid zones: Gaps off-screen but not mitigated remain in play — perfect for anticipating future reactions.
Gauge market bias at a glance: The balance of bullish vs. bearish FVGs helps you understand overall directional pressure.
Plan entries confidently: Use the table to reference all zones for risk management, confluence stacking, or layered execution strategies.
Instead of manually scanning your chart, the FVG Table offers a clean, at-a-glance overview of the market’s inefficiencies — giving you the structure needed to act with precision.
█ Settings
FVG Timeframe
Select any timeframe to source FVGs independent of your current chart.
Sensitivity
Filter FVGs by how impulsive the move is — it helps you eliminate weak gaps.
Mitigated on Mid
Control whether gaps are removed at midpoint touch or full fill.
Table Settings
Control the table position and width. Cleanly view all active FVGs.
FVG Style
Customize gap box colors, length, and bullish/bearish overlays.
Trend Filter
Enable or disable the smoothed FVG-based trendline with customizable smoothing controls.
-----------------
Disclaimer
The content provided in my scripts, indicators, ideas, algorithms, and systems is for educational and informational purposes only. It does not constitute financial advice, investment recommendations, or a solicitation to buy or sell any financial instruments. I will not accept liability for any loss or damage, including without limitation any loss of profit, which may arise directly or indirectly from the use of or reliance on such information.
All investments involve risk, and the past performance of a security, industry, sector, market, financial product, trading strategy, backtest, or individual's trading does not guarantee future results or returns. Investors are fully responsible for any investment decisions they make. Such decisions should be based solely on an evaluation of their financial circumstances, investment objectives, risk tolerance, and liquidity needs.

3 Candle AlertThis is a test for integration using a webhook. I am publishing it so I can share it. Ultimately, this is what we want to do:
1. Trade Entry Rules:
Wait until at least the 3rd bar of the day (15 minutes after market open) before entering the first trade.
Order of Priority for Entry:
Look for two consecutive volume bars of the same color (the second bar must have higher volume than the first).
Look for a “price push” beyond the high or low of the day (as determined in the first 15 minutes).
2. Trading Direction:
If the volume bars are RED, I take a Long Position.
If the volume bars are GREEN, I take a Short Position.
Volume Spread Analysis [Ahmed]Greetings everyone,
I'm thrilled to present a Pine Script I've crafted for Volume Spread Analysis (VSA) Indicator. This tool is aimed at empowering you to make smarter trading choices by scrutinizing the volume spread across a specified interval.
The script delivers a comparative volume analysis, permitting you to fix the type and length of the moving average. It subsequently delineates the moving average (MA), MA augmented by 1 standard deviation (SD), and MA increased by 2 SD. You can fully personalize the color coding for these echelons.
Volume Spread Analysis is an analytical technique that scrutinizes candles and the volume per candle to predict price direction. It considers the volume per candle, the spread range, and the closing price.
To effectively leverage VSA, you need to adhere to a few steps:
1. Ensure you use candlesticks for trading. Other chart types like line, bar, and renko charts may not yield optimal results.
2. Confirm that your broker provides reliable volume data.
3. Be mindful of the chart's timeframe. Volume analysis may not be effective on very short timeframes such as a minute chart. I recommend using daily, weekly, or monthly charts.
Another tip is to examine the spread between the price bars and the volume bars to discern the trend.
The script not only makes it easier to integrate these principles into your trading but also brings precision and convenience to your analysis.
Please remember to adhere to Tradinview terms of service when using the script. Happy trading!

The Normalizer [BVCC]The Normalizer adds an indicator to your chart with the option to view regular Volume, normalized Volume or normalized price.
Normalized Volume divides the current Volume bar into a moving average and multiplies by 100. The resulting plot is a histogram showing how far above or below the moving average that volume bar was.
Normalized Price does the exact same thing, but uses the close price of the current candle.
The result of a normalized bar chart is that sometimes activities of unusually low or high patterns can be seen that are not obvious when looking at the standard data points.
Customizable Settings include;
1) Check/Uncheck the first box to set the view to Volume or Price
2) Check 'Normalize' when on Volume to toggle between standard Volume and Normalized Volume
3) Price is always Normalized
4) Normalization is calculated from the SMA and the default is set to 9 - John Bollinger suggest setting this to 50
5) Normalization period can be set with the 'Period' option
This indicator was created for members of the BVCC trading community as an example of the normalization methods described in John Bollinger's "Bollinger on Bollinger Bands". Mr. Bollinger talks extensively about normalization and specifically volume normalization. I added the price normalization as a fun bonus just because. :)

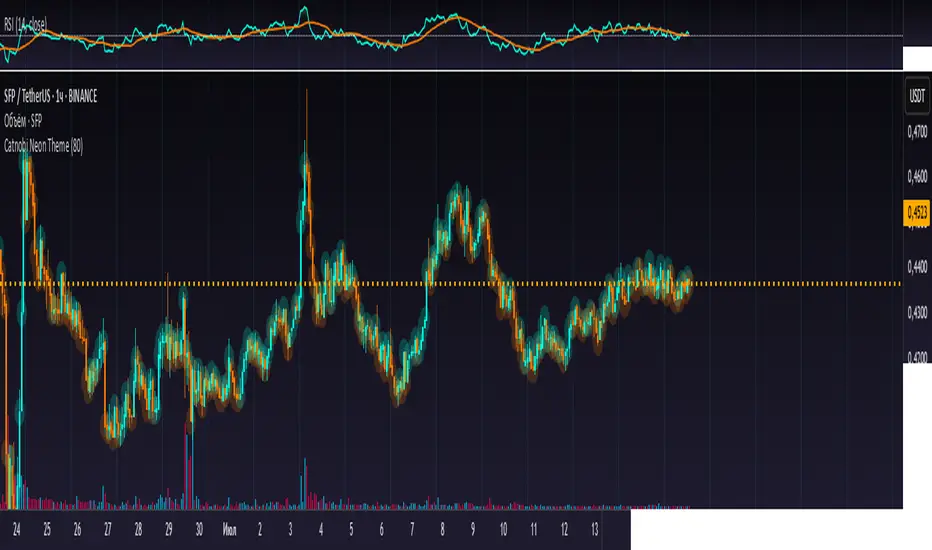
Catnobi Neon ThemeCatnobi Neon Theme 80 — A Purely Visual Candle-Glow Overlay (Open-Source)
What the script does
Catnobi Neon Theme 80 swaps the regular candle view for a vivid neon-glow style:
Candles (body + wicks) show up in bright turquoise when the bar closes up and in bright amber when it closes down.
Glow halo A soft, semi-transparent outline surrounds every candle, giving the impression of neon light.
Volume histogram Bars use the same palette as the candles so the entire chart keeps a consistent, cyber-punk colour scheme.
The script contains no trading signals, alerts, or calculations—it is purely decorative.
How it works (high-level)
Dual plot() technique – Each candle is drawn twice:
an enlarged, low-opacity outline creates the halo;
a second, normal-width layer renders the actual candle.
plotcandle() core – Price is still displayed with Pine’s built-in candle plotting, so the visual effect never distorts OHLC values.
Volume overlay – A simple plot() of volume with the same colour map keeps chart styling unified.
Because only basic Pine primitives are used, the script is light on resources and responsive even on lower-end machines.
Inputs / Settings
Input name Purpose Range / type Default
Theme Pick one of five curated colour sets 1 – 5 3
Glow width Thickness of the halo line (pixels) 1 – 10 4 px
Glow opacity Halo transparency 0 – 100 % 70 %
Hide volume Toggle neon volume bars true/false false
All colours are defined in HSL space, so you can easily tweak hues without losing contrast.
How to use it
Switch to a dark chart background – The glow effect is optimised for dark hex #0e0e0e, but any dark theme works.
Add Catnobi Neon Theme 80 as an overlay indicator.
(Optional) Hide the native candles via Chart settings ▸ Symbol ▸ Bar color opacity = 0 %.
Experiment with Theme, Glow width, and Glow opacity until the style matches your preference.
Why it qualifies for publication
Open-source – Code is fully visible, so the script does not fall under the “closed-source needs unique logic” rule.
Originality is visual, not trading – There are many indicator strategies, but very few lightweight, purely aesthetic glow overlays that rely solely on stock Pine functions.
Clear description – Users know exactly what to expect (no hidden buy/sell logic) and how the glow is generated.
MIT License
This script is released under the MIT licence. Feel free to fork, adapt, or redistribute—just keep the original author attribution somewhere in your code header.
The script is intended for traders who enjoy a cyber-punk vibe on their charts without compromising clarity or performance. Happy glowing!
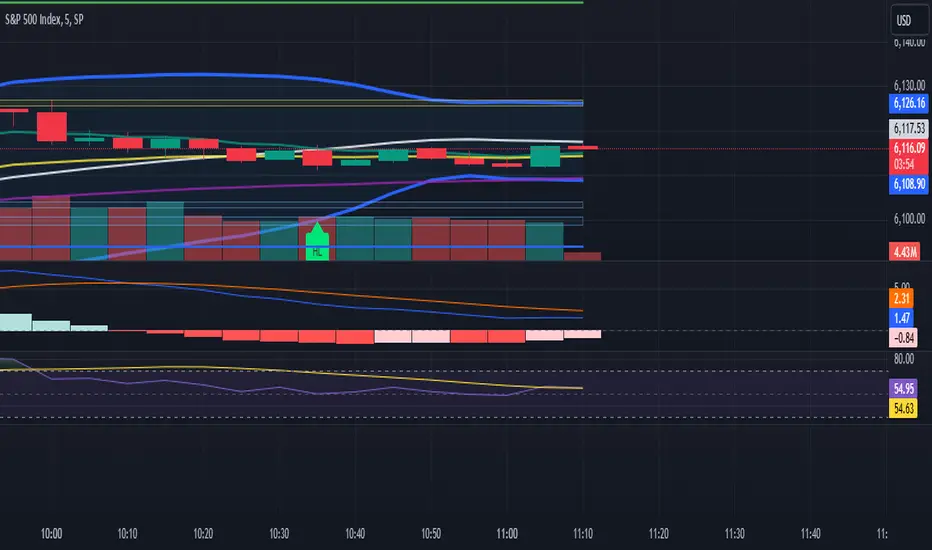
4-EMA Signals + MTF Analysis4-EMA Signals + MTF Analysis Indicator: User Guide
This indicator is designed for active traders; from scalpers / intra-day traders to swing-traders who simply want an easy to understand, simple, but yet comprehensive and easy-to-understand indicator with a quick overview of initial market momentum and overall market direction to assist the trader in their initial trading.
The main feature of this indicator is that It overlays four exponential moving averages (EMAs), and provides a dashboard of real-time trend signals for both buy and sell (long/short) scenarios.
Settings Overview
MA Period Setup
Custom: Set your own EMA periods.
Conservative, Aggressive, Fibonacci: Quickly apply preset EMA period combinations for different trading styles.
EMA Periods (Custom Setup)
Fast EMA: Shortest EMA, reacts quickly to price (default 7).
Medium-Short EMA: Intermediate speed (default 25).
Medium-Long EMA: Slower, filters out more noise (default 70).
Slow EMA: Longest-term trend (default 200).
(These settings can be adjusted to suit your individual needs)
Main Indicator Features
Four EMAs : Plotted in distinct colors (green, yellow, orange, red) for quick trend recognition - this can be altered in colour to your personal preferences.
Buy/Sell Signals : Triangles appear below/above bars when EMA crossovers occur, optionally filtered by volume - the volume filter when applied greatly reduces the influx of signals, only giving high-quality signals!
Trading Sessions + Backgrounds : A trading session feature has been added: (London, New York, Asia, Sydney) with the choice of a background to indicate each global trading session.
Volume Overlay : Volume bars and a blue volume moving average line for context.
Dashboard Table (Top Right):
Market Direction: Shows the overall EMA alignment (bullish, bearish, weak, consolidating).
The initial trend on the 5m, 15m, 1H, and 4H time-frame to give a quick snapshot of overall trend direction.
How to Use
Trend Identification :
-- Use the EMA alignment and dashboard table to quickly see if the market is bullish, bearish, or consolidating.
EMA Set-up
-- Adjust the EMA settings to your specific requirements, the signals will alter depending on the volatility of the instrument your trading.
Signal Confirmation :
-- ''Buy'' signals simply appear when the faster EMAs cross above slower EMAs in and ''Sell'' signals simply appear when they cross below.
Volume Context :
--Use the volume moving average and the optional volume filter to avoid signals during low-activity periods.
No Repainting :
-- All signals and dashboard readings are calculated using only confirmed, closed bars. What you see in real time is exactly what will appear in your back-test — no repainting or look-ahead bias.
Alerts / Notifications
Now for the fun part:
1. Enable Buy/Sell Signal Alerts: Get notifications when buy or sell signals occur.
2. For Alerts to function correctly, set the ''condition'' to the indicator itself.
3. Select ''EMA Bearish Cross'' or ''EMA Bullish Cross'' depending whether you want alerts for either buy/sell signals - Or one can simply set alerts for both scenarios.
4. For ''Interval'' set to ''Same as chart'' - So, the time-frame which you'd like to trade on.
5. For ''Trigger'' set to ''Once Per Bar Close''.
6. Save.
7. Wait for a signal to occur!
NOTE: Before placing a trade, it's often best to also assess the market conditions at that time also - and not rely solely on the signals, the signals are to assist, and it's often occurred a signal has shown, but a pull-back occurs, and a FVG in discount holds -- it's this FVG holding, accompanied by volume, that's the real entry, possibly.
Tip: For the cleanest results, use the indicator during the most active sessions and always check multi-time-frame trend alignment before entering trades. Good Luck! :)

Stacked Bullish vs Bearish VolumeThis indicator visually represents buying (bullish) and selling (bearish) pressure within each candle by stacking both portions inside a single volume bar. Unlike traditional volume indicators that use only one color per bar, this script splits each volume bar into two segments:
Green portion (Bullish Volume) → Represents the buying pressure when the price moves up.
Red portion (Bearish Volume) → Represents the selling pressure when the price moves down.
By stacking buy and sell volume inside the same column, traders can easily assess the balance of buying vs selling activity within each trading session.
Stacking the Bars:
The bullish portion (green) is plotted first.
The bearish portion (red) is plotted slightly offset to create a stacked effect.

Price Action Smart Money Concepts [BigBeluga]THE SMART MONEY CONCEPTS Toolkit
The Smart Money Concepts [ BigBeluga ] is a comprehensive toolkit built around the principles of "smart money" behavior, which refers to the actions and strategies of institutional investors.
The Smart Money Concepts Toolkit brings together a suite of advanced indicators that are all interconnected and built around a unified concept: understanding and trading like institutional investors, or "smart money." These indicators are not just randomly chosen tools; they are features of a single overarching framework, which is why having them all in one place creates such a powerful system.
This all-in-one toolkit provides the user with a unique experience by automating most of the basic and advanced concepts on the chart, saving them time and improving their trading ideas.
Real-time market structure analysis simplifies complex trends by pinpointing key support, resistance, and breakout levels.
Advanced order block analysis leverages detailed volume data to pinpoint high-demand zones, revealing internal market sentiment and predicting potential reversals. This analysis utilizes bid/ask zones to provide supply/demand insights, empowering informed trading decisions.
Imbalance Concepts (FVG and Breakers) allows traders to identify potential market weaknesses and areas where price might be attracted to fill the gap, creating opportunities for entry and exit.
Swing failure patterns help traders identify potential entry points and rejection zones based on price swings.
Liquidity Concepts, our advanced liquidity algorithm, pinpoints high-impact events, allowing you to predict market shifts, strong price reactions, and potential stop-loss hunting zones. This gives traders an edge to make informed trading decisions based on liquidity dynamics.
🔵 FEATURES
The indicator has quite a lot of features that are provided below:
Swing market structure
Internal market structure
Mapping structure
Adjustable market structure
Strong/Weak H&L
Sweep
Volumetric Order block / Breakers
Fair Value Gaps / Breakers (multi-timeframe)
Swing Failure Patterns (multi-timeframe)
Deviation area
Equal H&L
Liquidity Prints
Buyside & Sellside
Sweep Area
Highs and Lows (multi-timeframe)
🔵 BASIC DEMONSTRATION OF ALL FEATURES
1. MARKET STRUCTURE
The preceding image illustrates the market structure functionality within the Smart Money Concepts indicator.
➤ Solid lines: These represent the core indicator's internal structure, forming the foundation for most other components. They visually depict the overall market direction and identify major reversal points marked by significant price movements (denoted as 'x').
➤ Internal Structure: These represent an alternative internal structure with the potential to drive more rapid market shifts. This is particularly relevant when a significant gap exists in the established swing structure, specifically between the Break of Structure (BOS) and the most recent Change of High/Low (CHoCH). Identifying these formations can offer opportunities for quicker entries and potential short-term reversals.
➤ Sweeps (x): These signify potential turning points in the market where liquidity is removed from the structure. This suggests a possible trend reversal and presents crucial entry opportunities. Sweeps are identified within both swing and internal structures, providing valuable insights for informed trading decisions.
➤ Mapping structure: A tool that automatically identifies and connects significant price highs and lows, creating a zig-zag pattern. It visualizes market structure, highlights trends, support/resistance levels, and potential breakouts. Helps traders quickly grasp price action patterns and make informed decisions.
➤ Color-coded candles based on market structure: These colors visually represent the underlying market structure, making it easier for traders to quickly identify trends.
➤ Extreme H&L: It visualizes market structure with extreme high and lows, which gives perspective for macro Market Structure.
2. VOLUMETRIC ORDER BLOCKS
Order blocks are specific areas on a financial chart where significant buying or selling activity has occurred. These are not just simple zones; they contain valuable information about market dynamics. Within each of these order blocks, volume bars represent the actual buying and selling activity that took place. These volume bars offer deeper insights into the strength of the order block by showing how much buying or selling power is concentrated in that specific zone.
Additionally, these order blocks can be transformed into Breaker Blocks. When an order block fails—meaning the price breaks through this zone without reversing—it becomes a breaker block. Breaker blocks are particularly useful for trading breakouts, as they signal that the market has shifted beyond a previously established zone, offering opportunities for traders to enter in the direction of the breakout.
Here's a breakdown:
➤ Bear Order Blocks (Red): These are zones where a lot of selling happened. Traders see these areas as places where sellers were strong, pushing the price down. When the price returns to these zones, it might face resistance and drop again.
➤ Bull Order Blocks (Green): These are zones where a lot of buying happened. Traders see these areas as places where buyers were strong, pushing the price up. When the price returns to these zones, it might find support and rise again.
These Order Blocks help traders identify potential areas for entering or exiting trades based on past market activity. The volume bars inside blocks show the amount of trading activity that occurred in these blocks, giving an idea of the strength of buying or selling pressure.
➤ Breaker Block: When an order block fails, meaning the price breaks through this zone without reversing, it becomes a breaker block. This indicates a significant shift in market liquidity and structure.
➤ A bearish breaker block occurs after a bullish order block fails. This typically happens when there's an upward trend, and a certain level that was expected to support the market's rise instead gives way, leading to a sharp decline. This decline indicates that sellers have overcome the buyers, absorbing liquidity and shifting the sentiment from bullish to bearish.
Conversely, a bullish breaker block is formed from the failure of a bearish order block. In a downtrend, when a level that was expected to act as resistance is breached, and the price shoots up, it signifies that buyers have taken control, overpowering the sellers.
3. FAIR VALUE GAPS:
A fair value gap (FVG), also referred to as an imbalance, is an essential concept in Smart Money trading. It highlights the supply and demand dynamics. This gap arises when there's a notable difference between the volume of buy and sell orders. FVGs can be found across various asset classes, including forex, commodities, stocks, and cryptocurrencies.
FVGs in this toolkit have the ability to detect raids of FVG which helps to identify potential price reversals.
Mitigation option helps to change from what source FVGs will be identified: Close, Wicks or AVG.
4. SWING FAILURE PATTERN (SFP):
The Swing Failure Pattern is a liquidity engineering pattern, generally used to fill large orders. This means, the SFP generally occurs when larger players push the price into liquidity pockets with the sole objective of filling their own positions.
SFP is a technical analysis tool designed to identify potential market reversals. It works by detecting instances where the price briefly breaks a previous high or low but fails to maintain that breakout, quickly reversing direction.
How it works:
Pattern Detection: The indicator scans for price movements that breach recent highs or lows.
Reversal Confirmation: If the price quickly reverses after breaching these levels, it's identified as an SFP.
➤ SFP Display:
Bullish SFP: Marked with a green symbol when price drops below a recent low before reversing upwards.
Bearish SFP: Marked with a red symbol when price rises above a recent high before reversing downwards.
➤ Deviation Levels: After detecting an SFP, the indicator projects white lines showing potential price deviation:
For bullish SFPs, the deviation line appears above the current price.
For bearish SFPs, the deviation line appears below the current price.
These deviation levels can serve as a potential trading opportunity or areas where the reversal might lose momentum.
With Volume Threshold and Filtering of SFP traders can adjust their trading style:
Volume Threshold: This setting allows traders to filter SFPs based on the volume of the reversal candle. By setting a higher volume threshold, traders can focus on potentially more significant reversals that are backed by higher trading activity.
SFP Filtering: This feature enables traders to filter SFP detection. It includes parameters such as:
5. LIQUIDITY CONCEPTS:
➤ Equal Lows (EQL) and Equal Highs (EQH) are important concepts in liquidity-based trading.
EQL: A series of two or more swing lows that occur at approximately the same price level.
EQH: A series of two or more swing highs that occur at approximately the same price level.
EQLs and EQHs are seen as potential liquidity pools where a large number of stop loss orders or limit orders may be clustered. They can be used as potential reverse points for trades.
This multi-period feature allows traders to select less and more significant EQL and EQH:
➤ Liquidity wicks:
Liquidity wicks are a minor representation of a stop-loss hunt during the retracement of a pivot point:
➤ Buy and Sell side liquidity:
The buy side liquidity represents a concentration of potential buy orders below the current price level. When price moves into this area, it can lead to increased buying pressure due to the execution of these orders.
The sell side liquidity indicates a pool of potential sell orders below the current price level. Price movement into this area can result in increased selling pressure as these orders are executed.
➤ Sweep Liquidation Zones:
Sweep Liquidation Zones are crucial for understanding market structure and potential future price movements. They provide insights into areas where significant market participants have been forced out of their positions, potentially setting up new trading opportunities.
🔵 USAGE & EXAMPLES
The core principle behind the success of this toolkit lies in identifying "confluence." This refers to the convergence of multiple trading indicators all signaling the same information at a specific point or area. By seeking such alignment, traders can significantly enhance the likelihood of successful trades.
MS + OBs
The chart illustrates a highly bullish setup where the price is rejecting from a bullish order block (POC), while simultaneously forming a bullish Swing Failure Pattern (SFP). This occurs after an internal structure change, marked by a bullish Change of Character (CHoCH). The price broke through a bearish order block, transforming it into a breaker block, further confirming the bullish momentum.
The combination of these elements—bullish order blocks, SFP, and CHoCH—creates a powerful bullish signal, reinforcing the potential for upward movement in the market.
SFP + Bear OB
This chart above displays a bearish setup with a high probability of a price move lower. The price is currently rejecting from a bear order block, which represents a key resistance area where significant selling pressure has previously occurred. A Swing Failure Pattern (SFP) has also formed near this bear order block, indicating that the price briefly attempted to break above a recent high but failed to sustain that upward movement. This failure suggests that buyers are losing momentum, and the market could be preparing for a move to the downside.
Additionally, we can toggle on the Deviation Area in the SFP section to highlight potential levels where price deviation might occur. These deviation areas represent zones where the price is likely to react after the Swing Failure Pattern:
BUY – SELL sides + EQL
The chart showcases a bullish setup with a high probability of price breaking out of the current sell-side resistance level. The market structure indicates a formation of Equal Lows (EQL), which often suggests a build-up of liquidity that could drive the price higher.
The presence of strong buy-side pressure (69%), indicated by the green zone at the bottom, reinforces this bullish outlook. This area represents a key support zone where buyers are outpacing sellers, providing the foundation for a potential upward breakout.
EQL + Bull ChoCh
This chart illustrates a potential bullish setup, driven by the formation of Equal Lows (EQL) followed by a bullish Change of Character (CHoCH). The presence of Equal Lows often signals a liquidity build-up, which can lead to a reversal when combined with additional bullish signals.
Liquidity grab + Bull ChoCh + FVGs
This chart demonstrates a strong bullish scenario, where several important market dynamics are at play. The price begins its upward momentum from Liquidity grab following a bullish Change of Character (CHoCH), signaling the transition from a bearish phase to a bullish one.
As the price progresses, it performs liquidity grabs, which serve to gather the necessary fuel for further movement. These liquidity grabs often occur before significant price surges, as large market participants exploit these areas to accumulate positions before pushing the price higher.
The chart also highlights a market imbalance area, showing strong momentum as the price moves swiftly through this zone.
In this examples, we see how the combination of multiple “smart money” tools helps identify a potential trade opportunities. This is just one of the many scenarios that traders can spot using this toolkit. Other combinations—such as order blocks, liquidity grabs, fair value gaps, and Swing Failure Patterns (SFPs)—can also be layered on top of these concepts to further refine your trading strategy.
🔵 SETTINGS
Window: limit calculation period
Swing: limit drawing function
Mapping structure: show structural points
Algorithmic Logic: (Extreme-Adjusted) Use max high/low or pivot point calculation
Algorithmic loopback: pivot point look back
Show Last: Amount of Order block to display
Hide Overlap: hide overlapping order blocks
Construction: Size of the order blocks
Fair value gaps: Choose between normal FVG or Breaker FVG
Mitigation: (close - wick - avg) point to mitigate the order block/imbalance
SFP lookback: find a higher / lower point to improve accuracy
Threshold: remove less relevant SFP
Equal H&L: (short-mid-long term) display longer term
Liquidity Prints: Shows wicks of candles where liquidity was grabbed
Sweep Area: Identify Sweep Liquidation areas
By combining these indicators in one toolkit, traders are equipped with a comprehensive suite of tools that address every angle of the Smart Money Concept. Instead of relying on disparate tools spread across various platforms, having them integrated into a single, cohesive system allows traders to easily see confluence and make more informed trading decisions.

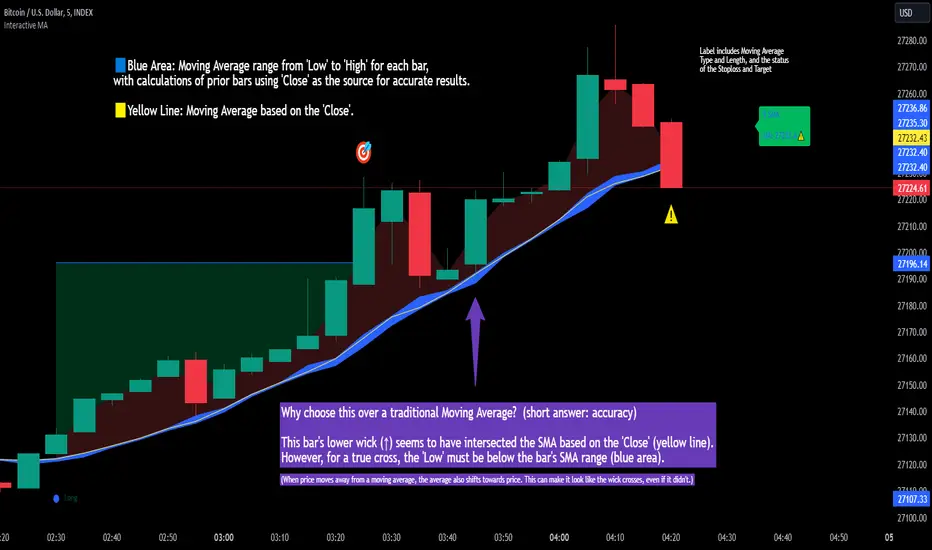
Interactive MA Stop Loss [TANHEF]This indicator is "Interactive." Once added to the chart, you need to click the start point for the moving average stoploss. Dragging it afterward will modify its position.
Why choose this indicator over a traditional Moving Average?
To accurately determine that a wick has crossed a moving average, you must examine the moving average's range on that bar (blue area on this indicator) and ensure the wick fully traverses this area.
When the price moves away from a moving average, the average also shifts towards the price. This can make it look like the wick crossed the average, even if it didn't.
How is the moving average area calculated?
For each bar, the moving average calculation is standard, but when the current bar is involved, its high or low is used instead of the close. For precise results, simply setting the source in a typical moving average calculation to 'Low' or 'High' is not sufficient in calculating the moving average area on a current bar.
Moving Average Options:
Simple Moving Average
Exponential Moving Average
Relative Moving Average
Weighted Moving Average
Indicator Explanation
After adding indicator to chart, you must click on a location to begin an entry.
The moving average type can be set and length modified to adjust the stoploss. An optional profit target may be added.
A symbol is display when the stoploss and profit target are hit. If a position is create that is not valid, "Overlapping MA and Bar" is displayed.
Alerts
'Check' alerts to use within indicator settings (stop hit and/or profit target hit).
Select 'Create Alert'
Set the condition to 'Interactive MA''
Select create.
Alert messages can have additional details using these words in between two Curly (Brace) Brackets:
{{stop}} = MA stop-loss (price)
{{upper}} = Upper MA band (price)
{{lower}} = Lower MA band (price)
{{band}} = Lower or Upper stoploss (word)
{{type}} = Long or Short stop-loss (word)
{{stopdistance}} = Stoploss Distance (%)
{{targetdistance}} = Target Distance (%)
{{starttime}} = Start time of stoploss (day:hour:minute)
{{maLength}} = MA Length (input)
{{maType}} = MA Type (input)
{{target}} = Price target (price)
{{trigger}} = Wick or Close Trigger input (input)
{{ticker}} = Ticker of chart (word)
{{exchange}} = Exchange of chart (word)
{{description}} = Description of ticker (words)
{{close}} = Bar close (price)
{{open}} = Bar open (price)
{{high}} = Bar high (price)
{{low}} = Bar low (price)
{{hl2}} = Bar HL2 (price)
{{volume}} = Bar volume (value)
{{time}} = Current time (day:hour:minute)
{{interval}} = Chart timeframe
{{newline}} = New line for text
I will add further moving averages types in the future. If you suggestions post them below.